- Rapidly generated shaking heatmaps post-magnitude 3.5+ quakes.
- Aid in assessing damage and inform emergency response.
- Valuable for engineering, infrastructure, and risk research.
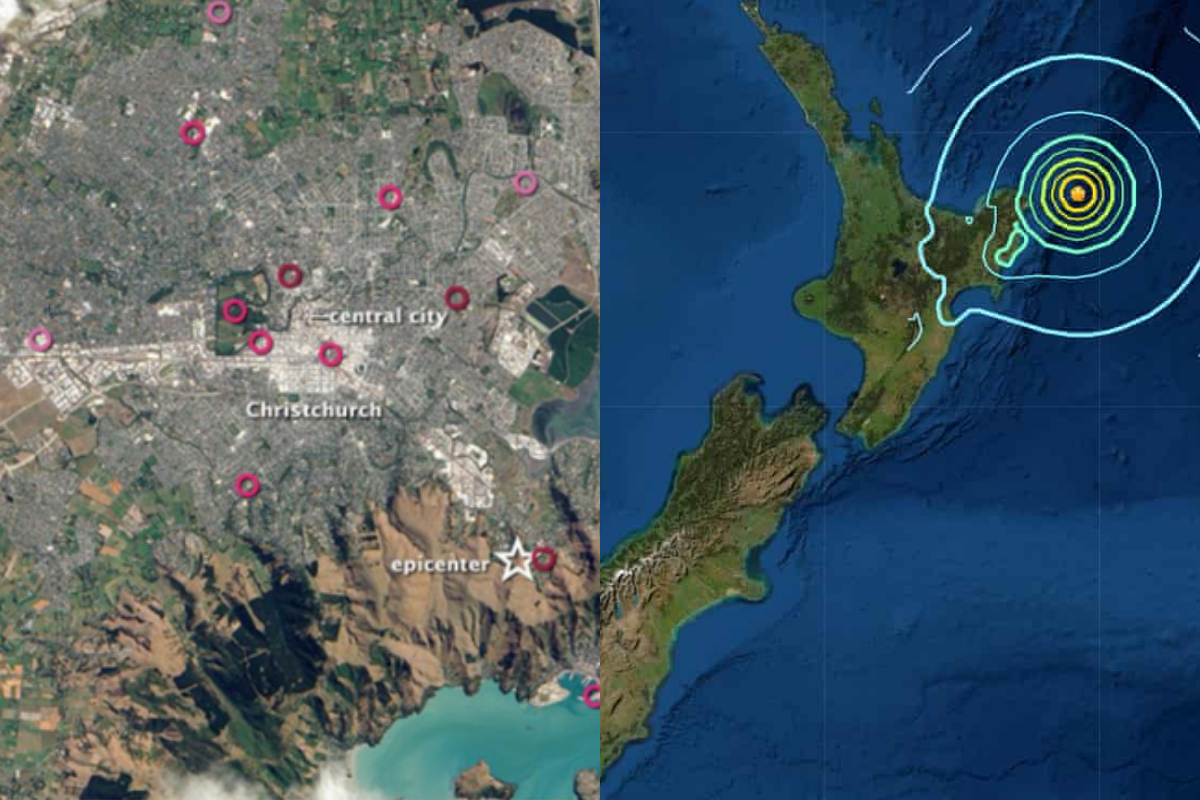
On Tuesday, New Zealand scientists unveiled “Shaking Layers” heatmaps that illustrate the intensity of seismic activity resulting from earthquakes in various parts of the country.
These maps have the potential to assist emergency responders in identifying areas with the highest likelihood of damage to buildings and infrastructure. They can also be valuable for the public to gauge the extent of shaking they experienced in their specific locations.
These heatmaps are generated automatically within 10 to 20 minutes after an earthquake with a magnitude of 3.5 or higher using data from ground motion sensors.
Users visiting the GeoNet earthquake monitoring website can zoom in on the maps to determine the strength of shaking in a particular area, as explained by GNS seismologist Nick Horspool.
The measure of shaking intensity relies on the modified Mercalli intensity scale, which characterizes the impact of the earthquake on people and their surroundings. For instance, an area with a shaking intensity measure of 4 would experience mild shaking, possibly causing walls to creak and windows to rattle.
The Shaking Layers maps have the potential to aid emergency response efforts by indicating both the level and location of potential damage to structures and infrastructure. This information can enable emergency responders to focus their resources where they are most needed. Additionally, it can be valuable for engineering assessments, infrastructure management, and research related to disaster risk reduction, according to Horspool.
[embedpost slug= “/new-york-city-racially-motivated-assault-caught-on-camera/”]