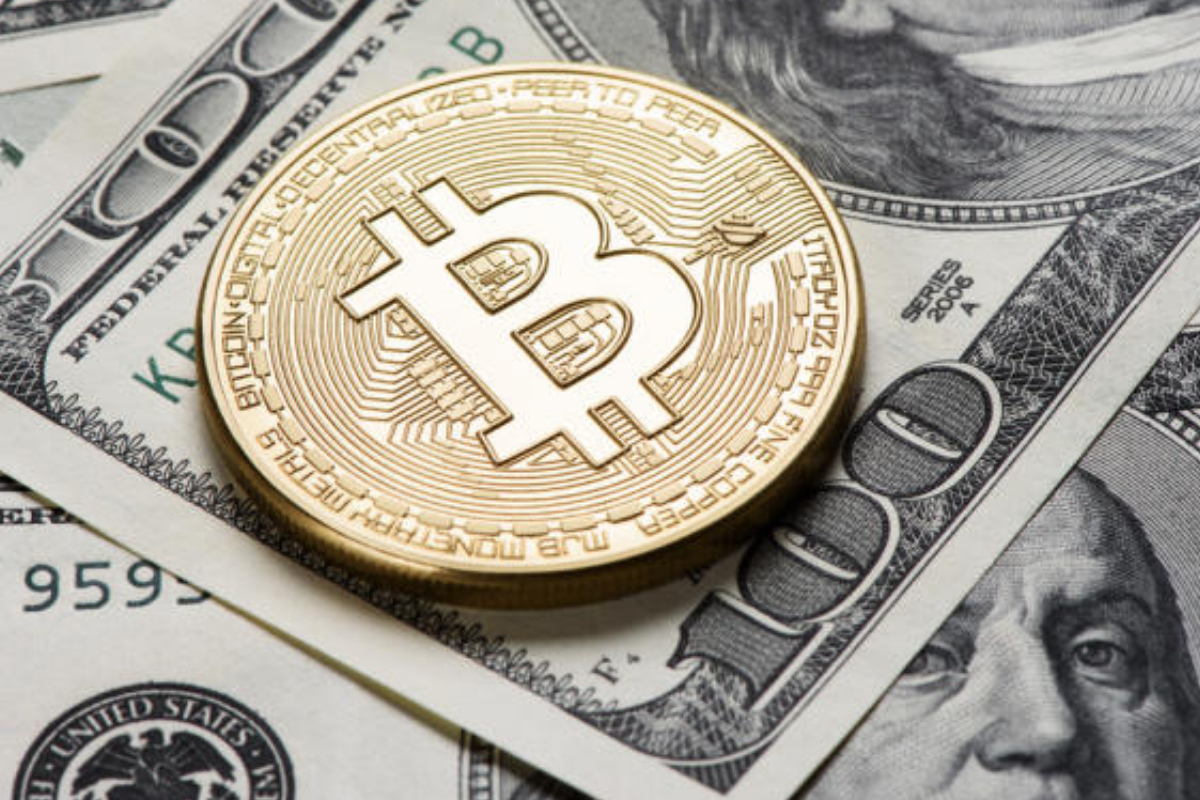
In 2021, cryptocurrencies‘ appeal remained strong. Goldman Sachs now accepts cryptocurrencies. The first significant cryptocurrency company to go public was Coinbase in April 2021, and the first U.S. exchange-traded fund with a focus on Bitcoin made its debut in October.
Bitcoin, the most well-known cryptocurrency, had a successful year. Since the beginning of 2021, the value of the digital currency has increased by almost 70%, increasing the total market value of cryptocurrencies beyond $2 trillion.
If the past of cryptocurrencies is any indicator of the future, investors may expect a thrilling journey. Here are some important bitcoin forecasts for 2023:
Ethereum Price Prediction
The price of Ethereum has confirmed the upward trend noted during the winter and has reached its optimal level of $1,450. Since ETH went over the $1,230 support region at the beginning of the month, analysts have predicted a probable test of the mid-$1,400 barrier.
At this time, the price of ethereum is $1,458. With ETH having gained 22% since January 1, traders that engaged in the bullish trade are doing handsomely.
The next important goals are close to $1,600. Since ETH dropped from $1660 to $1,073 during the first week of November, the price zone—a crucial liquidity level—has gone untagged.

The pivot point of $1,344 that was formed during the current trend could be used to invalidate the trade idea. A breach of the barrier can lead to a deeper correction with the $1,250 area acting as support. If the bears were to prevail, the price of ETH would decrease by 15%.
Bitcoin Price Prediction
The ongoing relief rally has increased by 20% since January 1 thanks to the 6% daily increase in the price of bitcoin. The daily surge, which is currently the highest daily gainer of the month, has broken through a trendline that had previously stopped previous uptrend attempts during the fall.
At this time, the price of one bitcoin is $20,017. Zooming out, the prior range displays convergent trendlines from the high on August 15 and low on June 18 as the BTC price was unable to break either side of the range during the summer and fall.
Practitioners of Elliott Wave theory propose a “Ending Diagonal” as a potential explanation for the constricting range.
The bullish target zones might be the fialnals origin point above the August high, leading in a further 25% rise from Bitcoin’s current price, if the recently breached trend line is a part of an ending diagonal pattern (often observed around market reversals).
Resistance levels are indicated at $20,430 and maybe $21,440 by a Fibonacci retracement level from the bullish cross of the 8-day exponential moving average and 21-day simple moving average at $16,655 and the $25,000 high.
Before BTC eventually moves in the direction of the projected target zone, these levels might serve as brief resistance points.

Cardano Price Prediction
Crypto traders continue to discuss the Cardano price as the digital smart contract token has remarkably risen since the beginning of 2023.
As of January 12, investors had received a 35% return on their investment in ADA. The recent relief rally gives off the unsettling impression that the ADA coin may have reached its macro bottom.
Cardano’s price is now bidding at $0.3287 after five straight days of positive trading activity. The trend’s slope has nearly reached a vertical position, allowing bulls to seize the liquidity above December’s monthly high of $0.3290.
In spite of the current upswing, the Relative Strength Index, an indicator that may be used to assess the potential of trending markets, displays encouraging signals.
The indicator shows that ADA is currently in the overbought region, which denotes sincere interest from swing trading bulls.
When compared to the typical $200,000 worth of transactions seen over the winter, the volume indicator more than quadrupled to $400,000, further supporting the optimistic idea.
There will probably be a pullback in the market at some time. Therefore, traders should keep an eye on the RSI for a landing zone at the midpoint and an increase in volume in relation to any future red days.
Up to a 21% increase from Cardano’s present market value, the psychological $0.4000 price threshold and liquidity over $0.3700 would be bullish targets.

A breach below the recently created ascending trendline would be the first indication of a trend shift. The critical threshold is now trading around $0.2800, but it might rise if Cardano’s price stays high and in line with the trend.
A break in the trend might lead to a scenario in which the lows are retested, ultimately posing a threat to the $0.2440 bottom in 2022. The negative scenario would result in a 27% drop in the ADA price.
[embedpost slug=”/cryptocurrency-price-prediction-eth-btc-cardano-14th-jan-2023/”]


