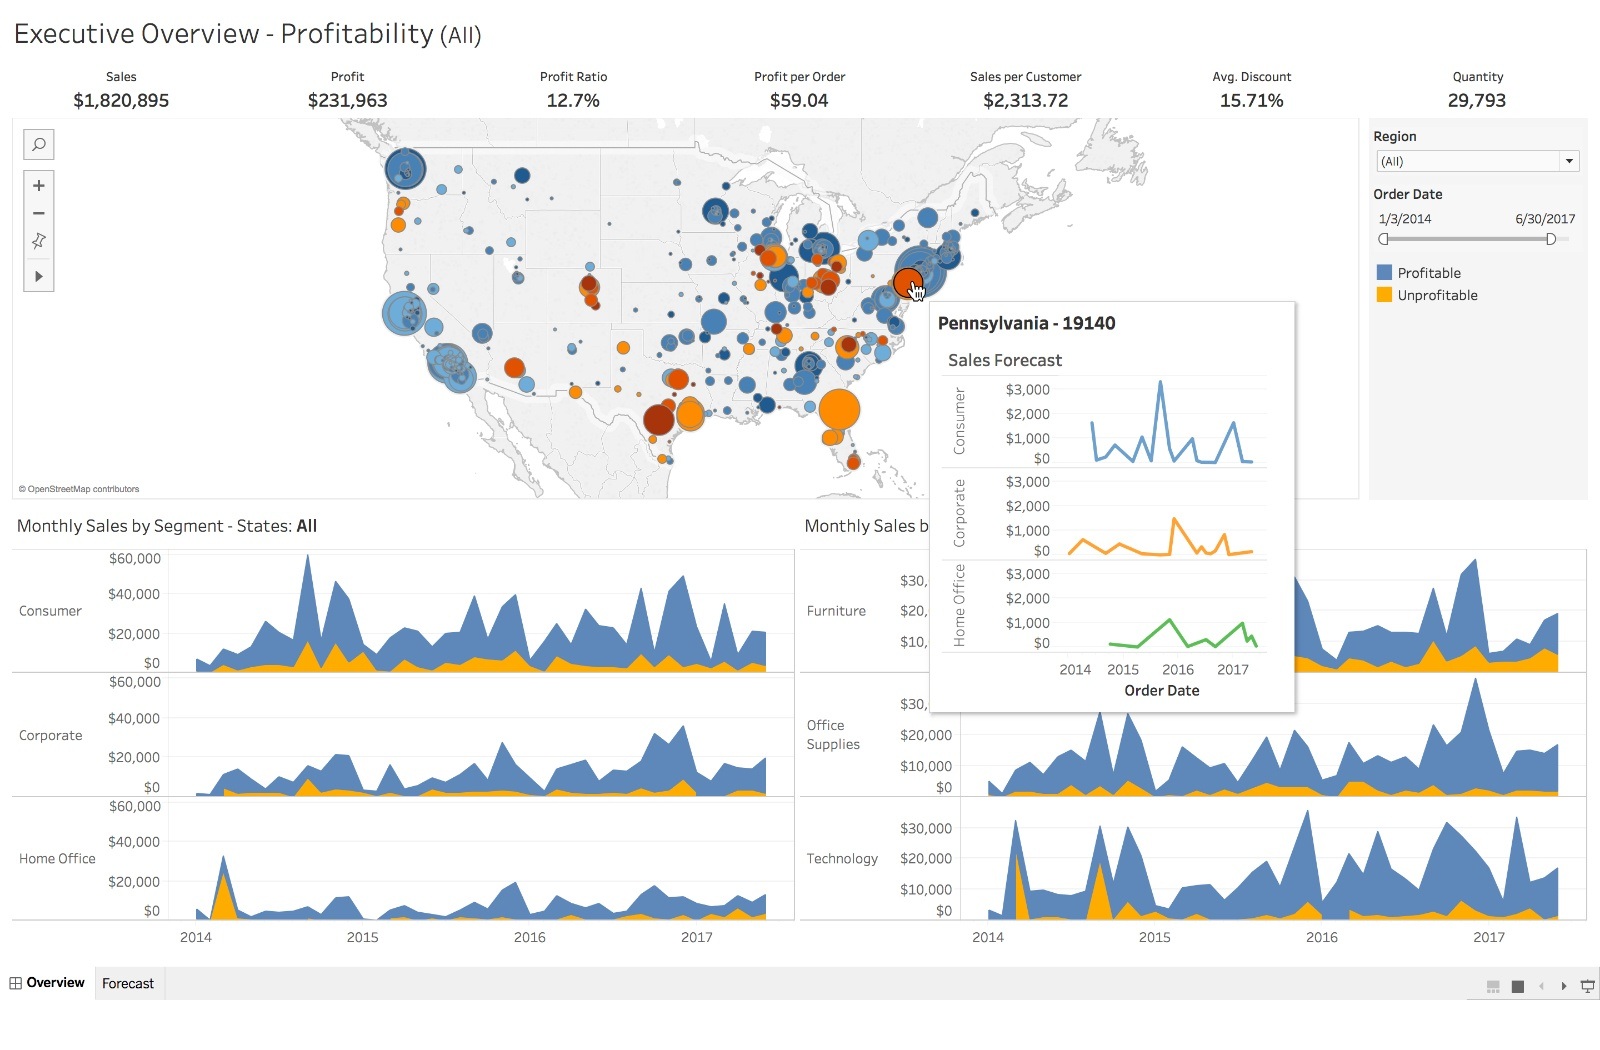
Tableau launched a new tool on Thursday that automatically adds plain-language explanations to dashboards, making it simpler for users to grasp the data they’re viewing. The new Data Stories functionality works at scale, removing the need for users to explain their dashboards again.
Tableau, the Salesforce-owned data visualization tool, introduced numerous new capabilities on Tuesday, including Data Stories. Tableau Cloud, the latest generation of Tableau online – the cloud-based version of its product geared for commercial users – was also unveiled.
While Tableau still provides self-managed services, the company’s emphasis on Tableau Cloud demonstrates how the enterprise has shifted mainly to SaaS offerings. According to the business, three-quarters of new Tableau customers choose its cloud offering over an on-premise or hybrid solution.
Tableau also announced the expansion of Accelerators, which are ready-to-use, configurable dashboards that can be utilized across numerous sectors, departments, and enterprise applications. More than 100 Accelerators are now available on the Tableau Exchange, a marketplace for solutions that expand the Tableau platform.
New admin features are also on the way, including Customer-Managed Encryption Keys for an extra layer of data security. The new Activity Log feature will provide admins with granular event data, allowing them to better understand how users interact with Tableau.
Tableau is also broadening the use of Business Science, a type of AI-powered analytics, by including it into CRM Analytics. A new Text Clustering function, for example, will use machine learning (ML) models to extract keywords from massive text fields.


